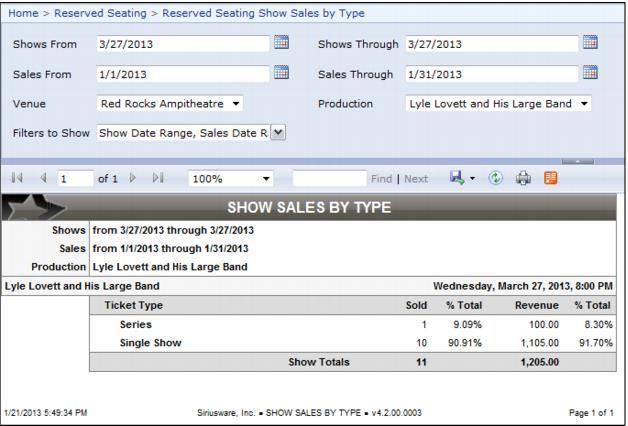
Show Sales by Type
Provides statistics on the seats sold within a series vs. a single show through a given date range per show. New report that details sales and revenue statistics by ticket type (Single Show versus Series) with subtotals by show for a selected production. Percent of total figures on this report are a reflection of the sale date filters entered, so the cumulative percentages are always 100.
Example:
If there were ten tickets sold for a show during the month of October and twenty-five tickets sold for a show during the month of November, and, if the report is run with a sale date filter of October 1 through October 31, the show type reflects its percentage of ten tickets, not its percentage of twenty-five tickets. This is due to those twenty-five tickets sold in November.